Every seat, settled.
Drag guests onto tables on a real floor plan. Capacity updates live, the guest list stays in sync, and the Post-it wall goes in the recycling.
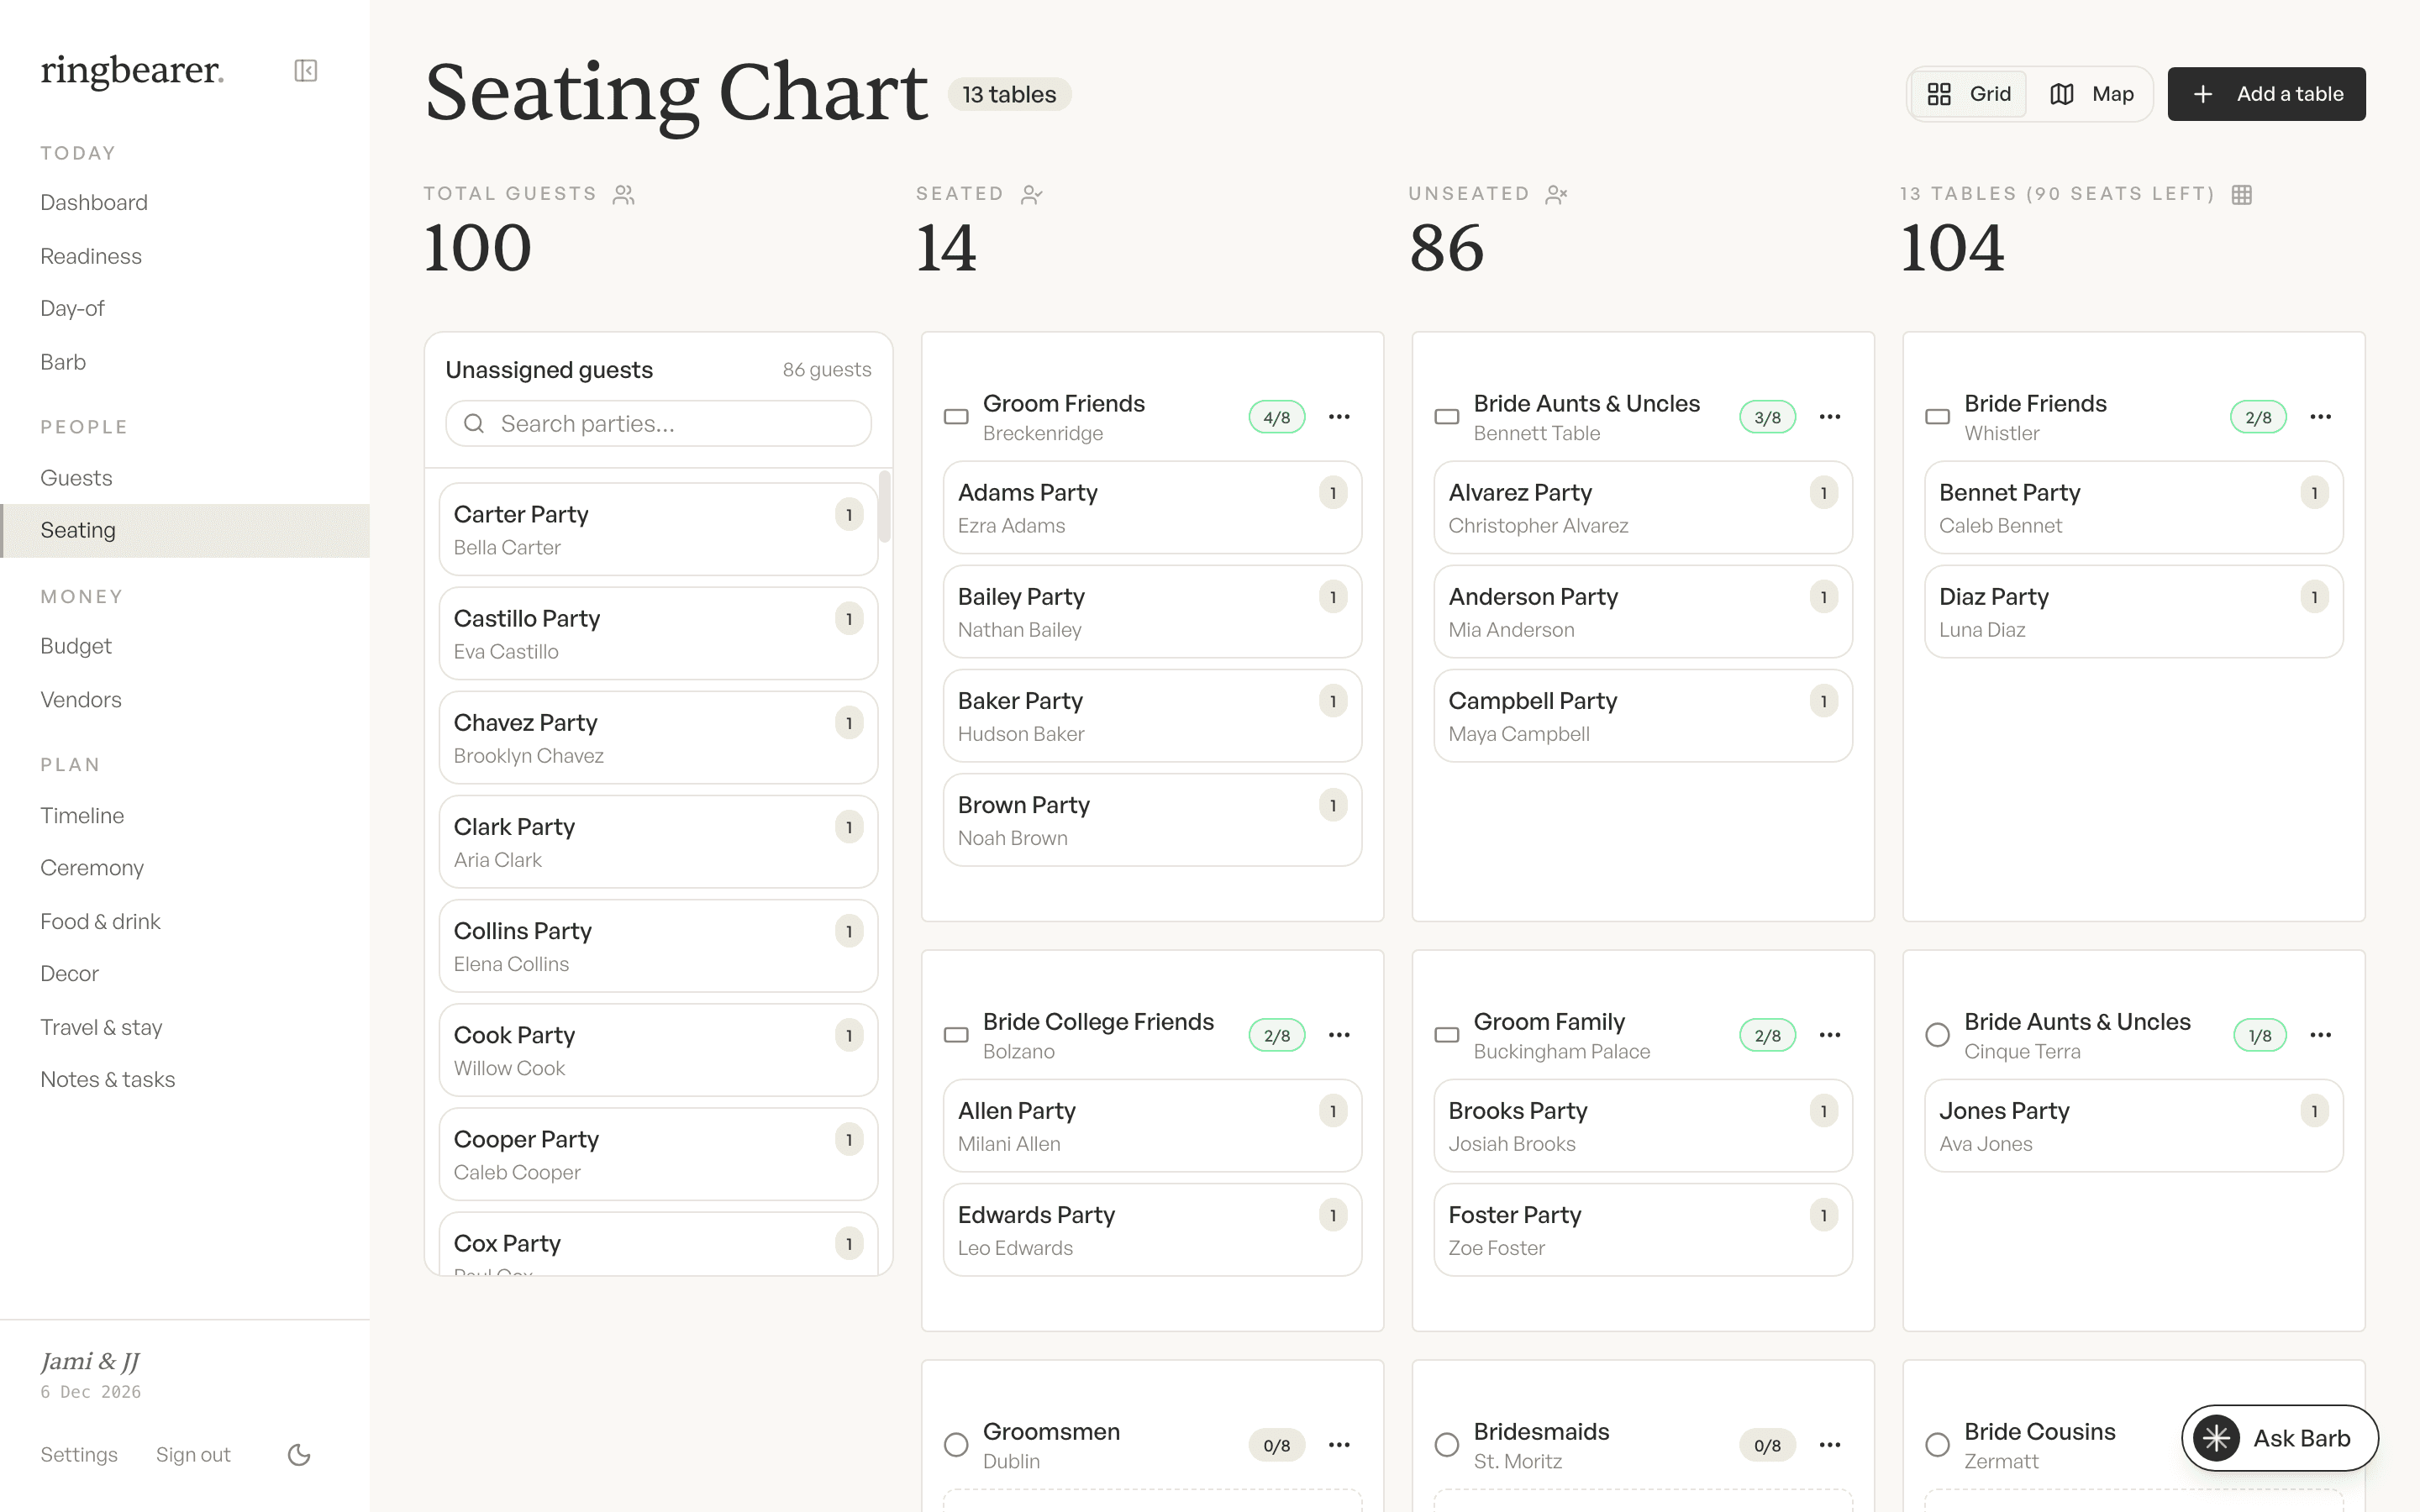
The seating chart is the last puzzle of the wedding, and the one with the most opinions. It has hard constraints (the room, the table sizes, the wheelchair aisle) and soft ones, like which two relatives need a minimum safe distance. And it changes every single time an RSVP lands.
Doing this on a poster board with sticky notes works right up until the third revision, somewhere around 80 guests. After that, every change means re-checking every table by hand. The chart here reads the live guest list, so a late decline doesn't mean starting over. It means dragging one name.
Spatial problems want spatial tools.
A floor plan, not a list of lists
Lay tables out the way the room is actually shaped: drag them into place, add the sweetheart table. Seating is spatial; the tool finally is too.
Two views, one truth
Work in the grid when you're assigning fast, switch to the map when you need to see the room. Both read the same data, so there's nothing to reconcile.
Capacity that counts itself
Seated and unseated counts stay in view, guests who declined don't count against you, and every table shows how many chairs are left. No more discovering table six has eleven people at midnight.
Rearrange without starting over
Moved a table to the wrong corner? Undo. Moving a party to another table is one drag, and the chart survives every RSVP change and every diplomatic renegotiation without starting over.
A 120-guest chart has been revised eleven times by the wedding. Here, revision twelve takes a minute, not an evening.
The method behind it: how to make a wedding seating chart.